MolScript View Commands
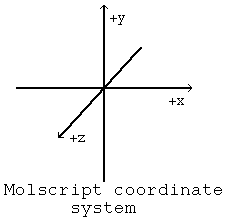
Molscript Coordinate System
The basis for orienting objects in a MolScript plot is the MolScript coordinate system. This system is analogous to a standard rectilinear Cartesian coordinate system and is diagrammed to the right. The page of a MolScript plot lies in the xy plane; the long axis is oriented along y, the short axis is oriented along x. The coordinate system is fixed. In order to create a view in a MolScript plot, the objects (molecules) must be rotated. Your view of the plot remains constant, objects in the plot are rotated to the desired orientation. Plot object orientations are changed by applying a transformation matrix.
Transformation Matrix
Coordinates are transformed through a series of rotation and translation commands which are combined into the transformation matrix. These matrix commands are responsible for the orientation of objects in the plot area. A typical transformation matrix (here generated via RasMol) looks like this:
 read mol "pdb9rnt.ent";
  transform atom *
    by centre position atom *
    by rotation x 180.0
    by rotation z 60.767
    by rotation y 1.21148
    by rotation x -154.0
    by translation 0.0 2.14186 0.0;
The first line "read mol...." is not part of the translation
matrix. It is the command to read in PDB file coordinates. It appears here for
the purpose of illustrating semicolon usage. A semicolon ends the read statement,
and a semicolon ends the translation matrix (the last character in the sample),
but there are no semicolons used within the transformation matrix. The
transformation matrix is a single command. The "transform atom *"
command sets the matrix to apply to all atoms, "atom *". The
"by centre position atom *" command aligns the center of gravity
of the molecule at the origin. All of the following commands will reflect this
centering. The translation matrix is then completed with a series of rotation
and a translation command. The general form of the rotation command is:
by rotation "axis" "rotation";
Here the "axis" is replaced by x, y or z. The
"rotation" is replaced by an angle measured in degrees. Positive
angle values are counter-clockwise rotations about the specified axis. As can
be noted in the example command, more than one rotation command for a single
axis is allowed. The consequence of this is that in fine-tuning an orientation,
it is best (and valid) to simply add another rotation command instead of
attempting to replace a rotation angle.
The general form of the translation command is:
by translation #.# #.# #.#;
The three numbers are, in order, x, y and z translations. The units of translation are Angstroms.
Area
The area command is specified by (X,Y) coordinates of the lower left corner and upper right corner of the plot area in postscript units. The average 8.5"x 11" paper is 0.0 0.0 for the lower left corner and 610.0 790.0 for the upper right corner, in postscript units. The default area is:
area 50.0 100.0 550.0 700.0;
The largest printable area is approximately:
area 30.0 30.0 580.0 760.0;
For those of you writing for the Thesis Office, Eric Hebert has calculated the area command parameters for blue-line paper. These coordinates will set the default frame of the Molscript plot directly on the blue line. The area statement including the coordinates is:
area 89.71 71.82 538.24 718.18;
When adding this command to an input file it should follow the plot header i.e. it should be the first command in the file.
This command also allows for the output of multiple plots to a single sheet of paper. Two or more plot to end_plot plots in a single input file will output all plots to the same sheet of paper. The area command for each plot is set to a subset of the paper area such that each plot occupies a unique area on the paper.
Window
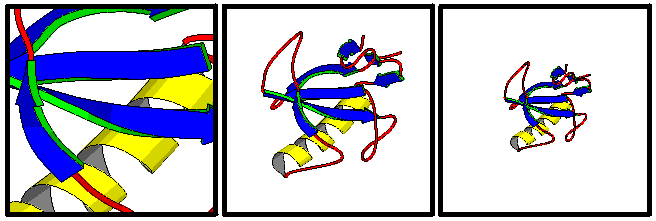
This command sets the side lengths (X and Y) of the area that is viewed. The default setting generously encompasses the plot. Setting a smaller window value increases the size of the objects drawn in the plot.
window 35.0;
An example of the use of the window command is shown below. Window can be used to "zoom in" on molecular detail. The absolute value of the window parameter is two times the value for the previous picture, i.e. the window values are, left to right, 1/2X, X, and 2X. The value X would be the normal value such that the entire molecule is included in the plot.
Slab
This command sets the length of the Z axis which is viewed. This allows for depth clipping of objects in the plot. The default slab value encompassed all objects.
slab 35.0;
Written and maintained by Kevin Shaw
Mail kevshaw at yea4us