The Graphics State
Secondary Structure
Any of the graphics commands for secondary structure follow the syntax:
helix from 13 to 29;
When RasMol generates the initial MolScript script, the secondary structure definitions are set. They are listed in the script based on primary structure. To sort the script by secondary structure try molsort, a simple algorithm for changing the sort from primary to secondary structure.
Any of the modifying graphical commands follow the syntax:
set parameter value;
set helixwidth 3.0;
Helix:
This command creates a smooth helical ribbon through the CA coordinates specified. The helix is idealized slightly but will still reflect any deviations from "regular" alpha helix geometry. The helix command can be modified by a number of graphical commands:
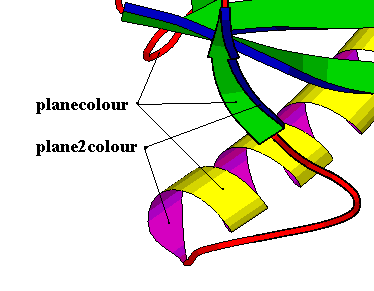
planecolour: colour of the outside of the helix
plane2colour: colour of the inside of the helix
helixwidth: default=2.4 Angstroms
helixthickness: applies only to Raster3D output, default=0.3 Angstroms
Strand:
This is the beta sheet arrow drawing command. An idealized arrow is drawn, N-term to C-term, through the CA positions of the defined residues. The strand command can be modified by a number of graphical commands:
planecolour: colour of the wide surface of the arrow
plane2colour: colour of the side of the arrow
strandthickness: height of arrow, default=0.6 Angstroms
strandwidth: width of large arrow surface, default=2.0 Angstroms
Coil:
This command draws an idealized coil through the residues specified. The coil passes through the exact CA positions for the first and last residue specified. The coil is highly smoothed between the beginning and end. To place CA atoms directly on the coil it is best to subdivide the coil statement such that it begins and ends on the CA atom of interest, i.e. coil from 10 to 20; can be divided to coil from 10 to 15; coil from 15 to 20; in order to draw the CA atom of residue 15 exactly on the coil.
coilradius: default=0.2 Angstroms
splinefactor: controls the smoothing routine, default=1.0, smaller values give less curvature to the coil.
Drawing atoms
Ball-and-stick
This graphics command draws atoms as small spheres connected by three- dimensionally depth cued sticks.
The general syntax is:
ball-and-stick in residue #;
This tyrosine sidechain is a good example of ball-and-stick output. The script command is listed below the sidechain.
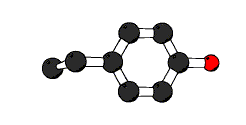
 ball-and-stick require not either atom C, atom O or atom N and in residue
#;
The algorithm draws selected atoms and connects all atoms within the sphere of radius equal to the parameter bonddistance. For this reason Molscript does not handle coordinate files with Hydrogen atoms well. Molscript will draw erroneous bonds between hydrogens. A logical statemant can be used to limit the drawn atoms and prevent this occurance.
Ball and stick output can be modified by a number of graphical commands: atomcolour: sets the colour of atoms, the default color scheme is by atom type:
- Carbon=black
- Nitrogen=blue
- Oxygen=red
- Sulfur=yellow
- Phosphorous=purple
atomcolour: changes the default atom colours. Any of the four methods of specifying colour will work.
bonddistance: sets the distance between atom centers for which bonds are
drawn,
default=1.9 Angstroms
CPK
CPK is the space-filling equivalent of ball-and-stick. A large sphere (van der Waals radius of the atom) is output at the atom position and contacts the spheres for the bonded atoms. CPK spheres are shaded in the "Donald Duck" style, three lines and the reflection of a window. This is evident in the cpk representation of the same tyrosine sidechain. The input script line appears below the molecule.
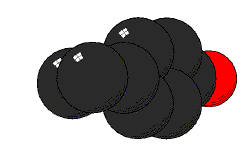
cpk require not either atom C, atom O or atom N and in residue #;
CPK output can be modified by a number of graphic parameters:
atomradius: sets the radius of the output sphere, default=van der Waals radius of atom type
atomcolour: sets the colour of output atoms, defaults equal to ball-and-stick colours
Labels
MolScript will output text labels. There are a number of default output strings as well as user defined label output. User defined output involves specifying a label position (X,Y,Z) in Angstroms of the centre of the label relative to the coordinate system along with the label output string. The output string is enclosed in double quotes. Output is in the Times New Roman or Symbol fonts. Labels are disregarded for Raster 3D output. An example script line is shown below.
label 1.0 2.5 -3.0 "output string";
Several graphics state commands apply to label output:
labelsize: default=20.0 postscript/normal font units
labelrotation: default=off, toggle switch for 90 degree label rotation
labelcentre: default=on, sets the XYZ coordinates to the centre of the label(on) or the lower left-hand corner(off)
labelmask: sets the font of the label, the string is enclosed in double quotes and r=roman, g=greek, .=no change.
Example:
set labelmask "grrggggr";

label 3.0 -15.4 0.0 "abcdefgh";
yields:
Written and maintained by Kevin Shaw
Mail kevshaw at yea4us